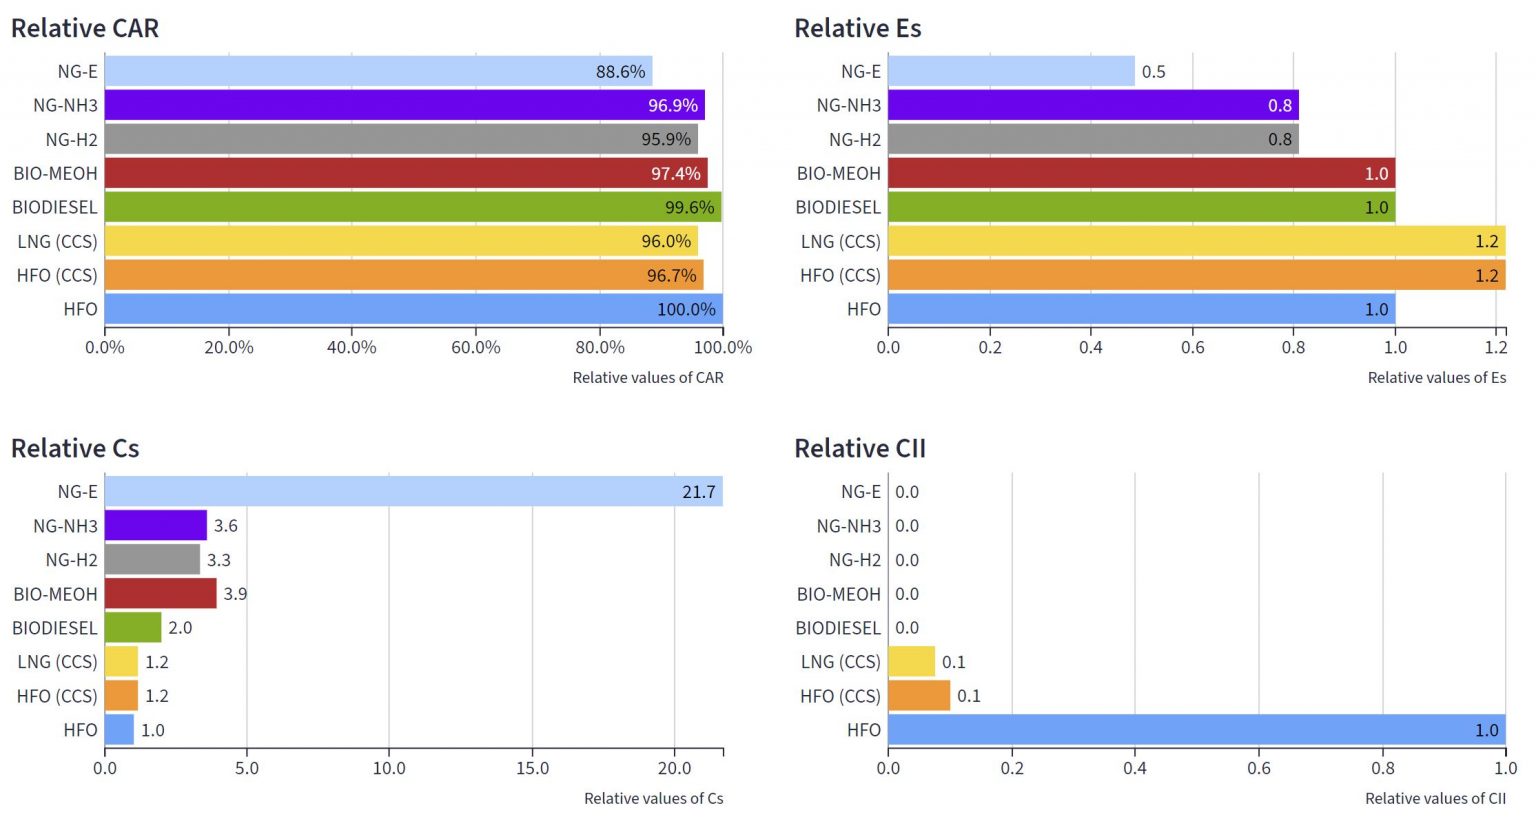
There are four bar charts that present the relative CAR, Es, Cs, and CII for ships powered by different marine fuels. By default, the relative CAR for HFO-ship is 100% and the relative Es, Cs, and CII are equal to 1.
Three types of ships are included which are tanker, cargo ship and container. The figure below shows the ship length (meters) of various types of ships and their categories. Generally, tanker and cargo ship are categorised based on ship deadweight, whereas container is defined based on the ship cargo capacity in twenty-foot equivalent units (TEU).
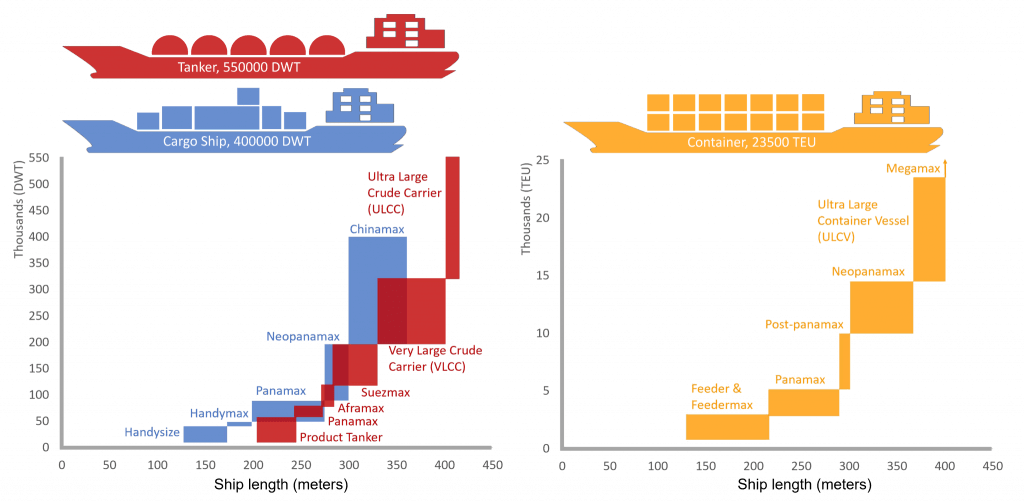
From the statistics of ship capacity, the largest ship sizes in operation today are 550,000 DWT. Hence, users can drag the slider for deadweight to define the size of their ships.
From the statistics of ship speed, the voyage speed has been reduced to minimise carbon emissions. In this study, users can adjust the voyage speed between 5 – 25 knots. This input is important to determine the duration of the voyage and fuel tank sizing based on the fuel consumption rate. Please note that the voyage speed does not affect the power rating of the ship which is another user-defined parameter.
As derived from the AIS data, the majority of ships travel between 4,000 to 11,000 nautical miles (n.m.). The voyage length input is adjustable between 2,000 to 20,000 nautical miles. This input is required for the calculation of voyage duration based on the input of speed. A longer voyage distance consumes more energy and requires more marine fuel to be stored onboard.
This input is required for the calculation of total fuel consumption per annum. The default setting for this input is 280 days, considering the days when a ship is bunkering and not operational.
After defining the fuel type (Parameter 6), users need to select an energy converter for their ship. Please note that the value of rated power which is in unit kilowatt (kw) is the maximum power rating for the energy converter. There are three type of energy converters which are internal combustion engine (ICE), electrical motor (EM), and Proton-exchange Membrane fuel cell in combination with electrical motor (PEMFC & EM). The energy conversion efficiency for ICE, EM, PEMFC & EM are assumed equal to 45%, 92.5%, and 55.5% respectively. This assumption is made based on the data available in the literature and the efficiency of energy conversion could be increased with more research & development. Refer to the paper “A Comparison of Alternative Fuels for Shipping in Terms of Lifecycle Energy and Cost” for more details.
In general, ship is not operated with 100% load; hence, users can adjust the engine loading between 0-100%.
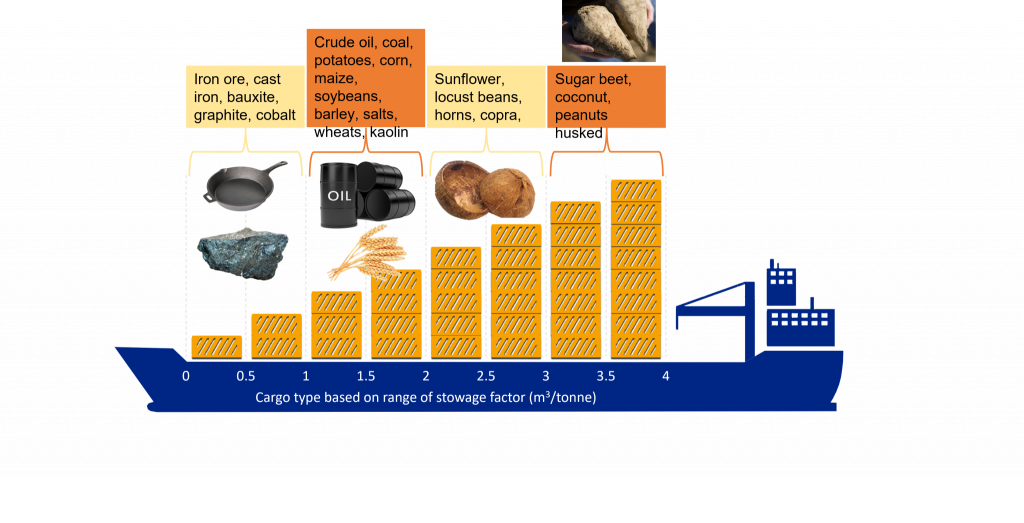
The quantity of cargoes that can be carried by a ship varies with the type of cargoes as they have varying densities and stowage factors. The figure below shows the general types of cargoes and their stowage factor in unit cubic meter per tons (m3/tons).